Best use of Elastic Agent Builder on Serverless
Ask what your agents did this week
Every step, tool call, cost, approval, blocked connection, undo and failure on a GurtOS box streams into an Elasticsearch Serverless project. An Elastic Agent Builder agent named GurtOS log answers questions about it in plain words, from six ES|QL tools and an index search tool that live in the repo as code.
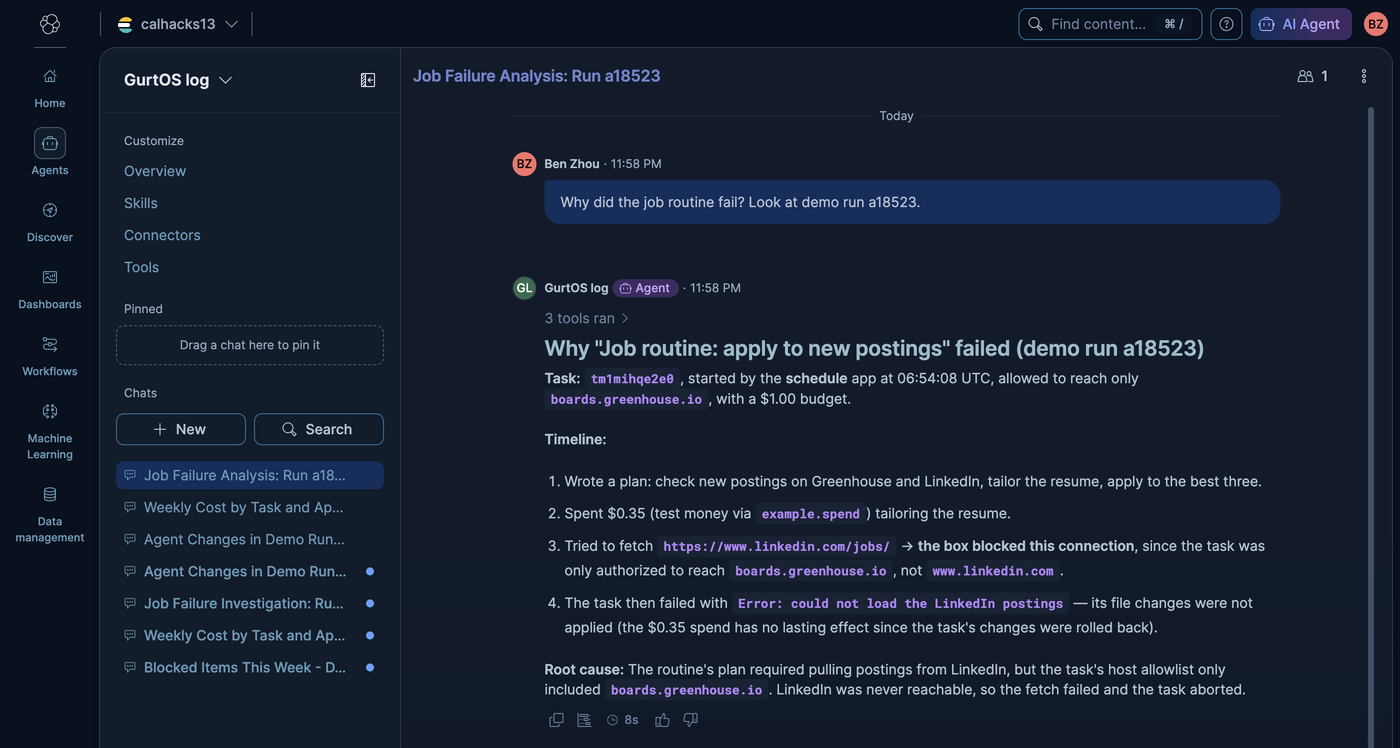
Proof Asked "Why did the job routine fail? Look at demo run a18523.", the agent found the failed task with box.failures, read its timeline and named the root cause itself: the routine was allowed to reach only boards.greenhouse.io, its plan needed www.linkedin.com, the box blocked it, and the task failed right after. A live run shipped all 156 events of a demo run to Serverless, each exactly once.
What Elastic asked for
Elastic had not published judging criteria when this was built (Oct 23, 8 PM PT). The track asks for an Elastic Agent Builder agent on a Serverless instance; each part of that is a row below.
An Elastic Agent Builder agent.
MetA custom agent,
gurtos-log(shown as GurtOS log), with seven custom tools: six parameterized ES|QL tools and one index search tool. The agent, its instructions and its tools are code intracks/elastic/agent.ts, created or updated with one command through the Agent Builder API, and asked through Kibana's chat and theconverseAPI.On a Serverless instance.
MetAn Elasticsearch Serverless project on GCP us-east4. The
box-actionsindex, the data and the agent all live there.Real data, used for something that matters.
MetEvery document comes from a box's own action log: the installed GurtOS boxes, and
DEMO_LIVE=elasticdemo runs with Droid tasks running Claude, the credit desk and the four demo moments. Dev boxes stay out of the index. The questions are the ones an owner asks the morning after: what changed, what it cost, why something failed, and what got blocked.
Screenshots
Open it yourself
- The agent and its tools as code, tracks/elastic/agent.tsThe Kibana project itself needs a sign-in to the project's Elastic account. The screenshots above are from it, at
/app/agent_builder/agents/gurtos-log. - The log reader and mapping, tracks/elastic/track.ts
- The track README
- Docs: send the log to Elastic
Evidence
The live run (DEMO_LIVE=elastic ./demo) shipped a whole demo run to Serverless, installed the agent and asked it four
questions. Every answer used the right tool:
track elastic
  ok    the offline tests pass
  ok    all 156 log events became documents, none lost to the hard kill in moment 4
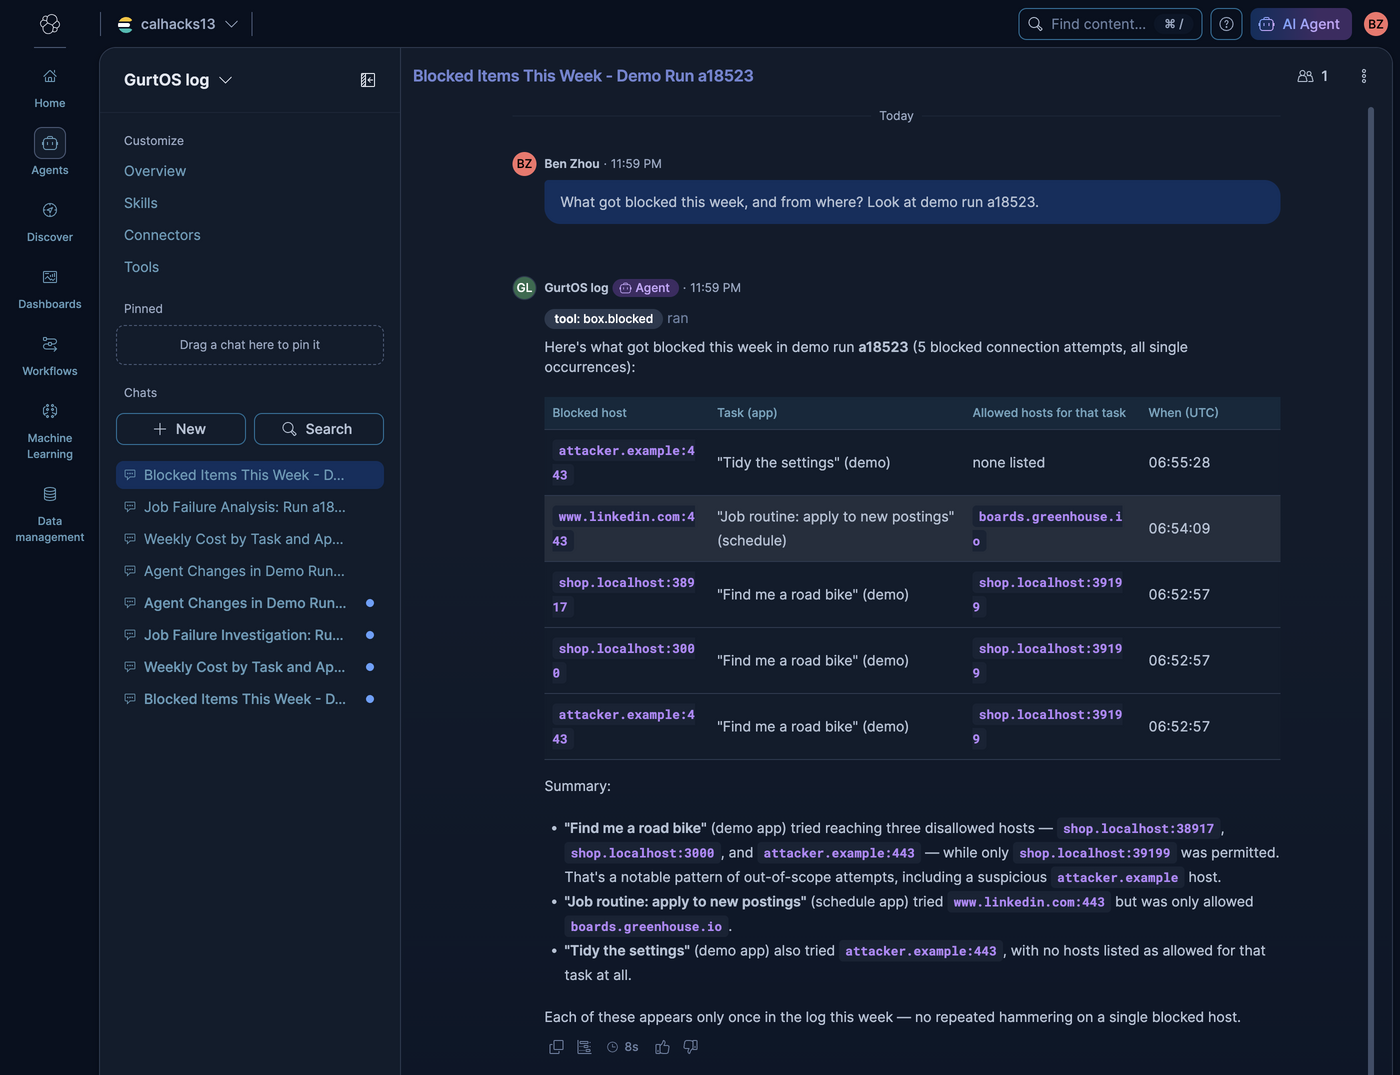
  ok    the blocked connection is a document with its task, app and allowed hosts: "The box blocked "Job routine: apply to new postings" from reaching www.linkedin.com:443; it may reach only boards.greenhouse.io"
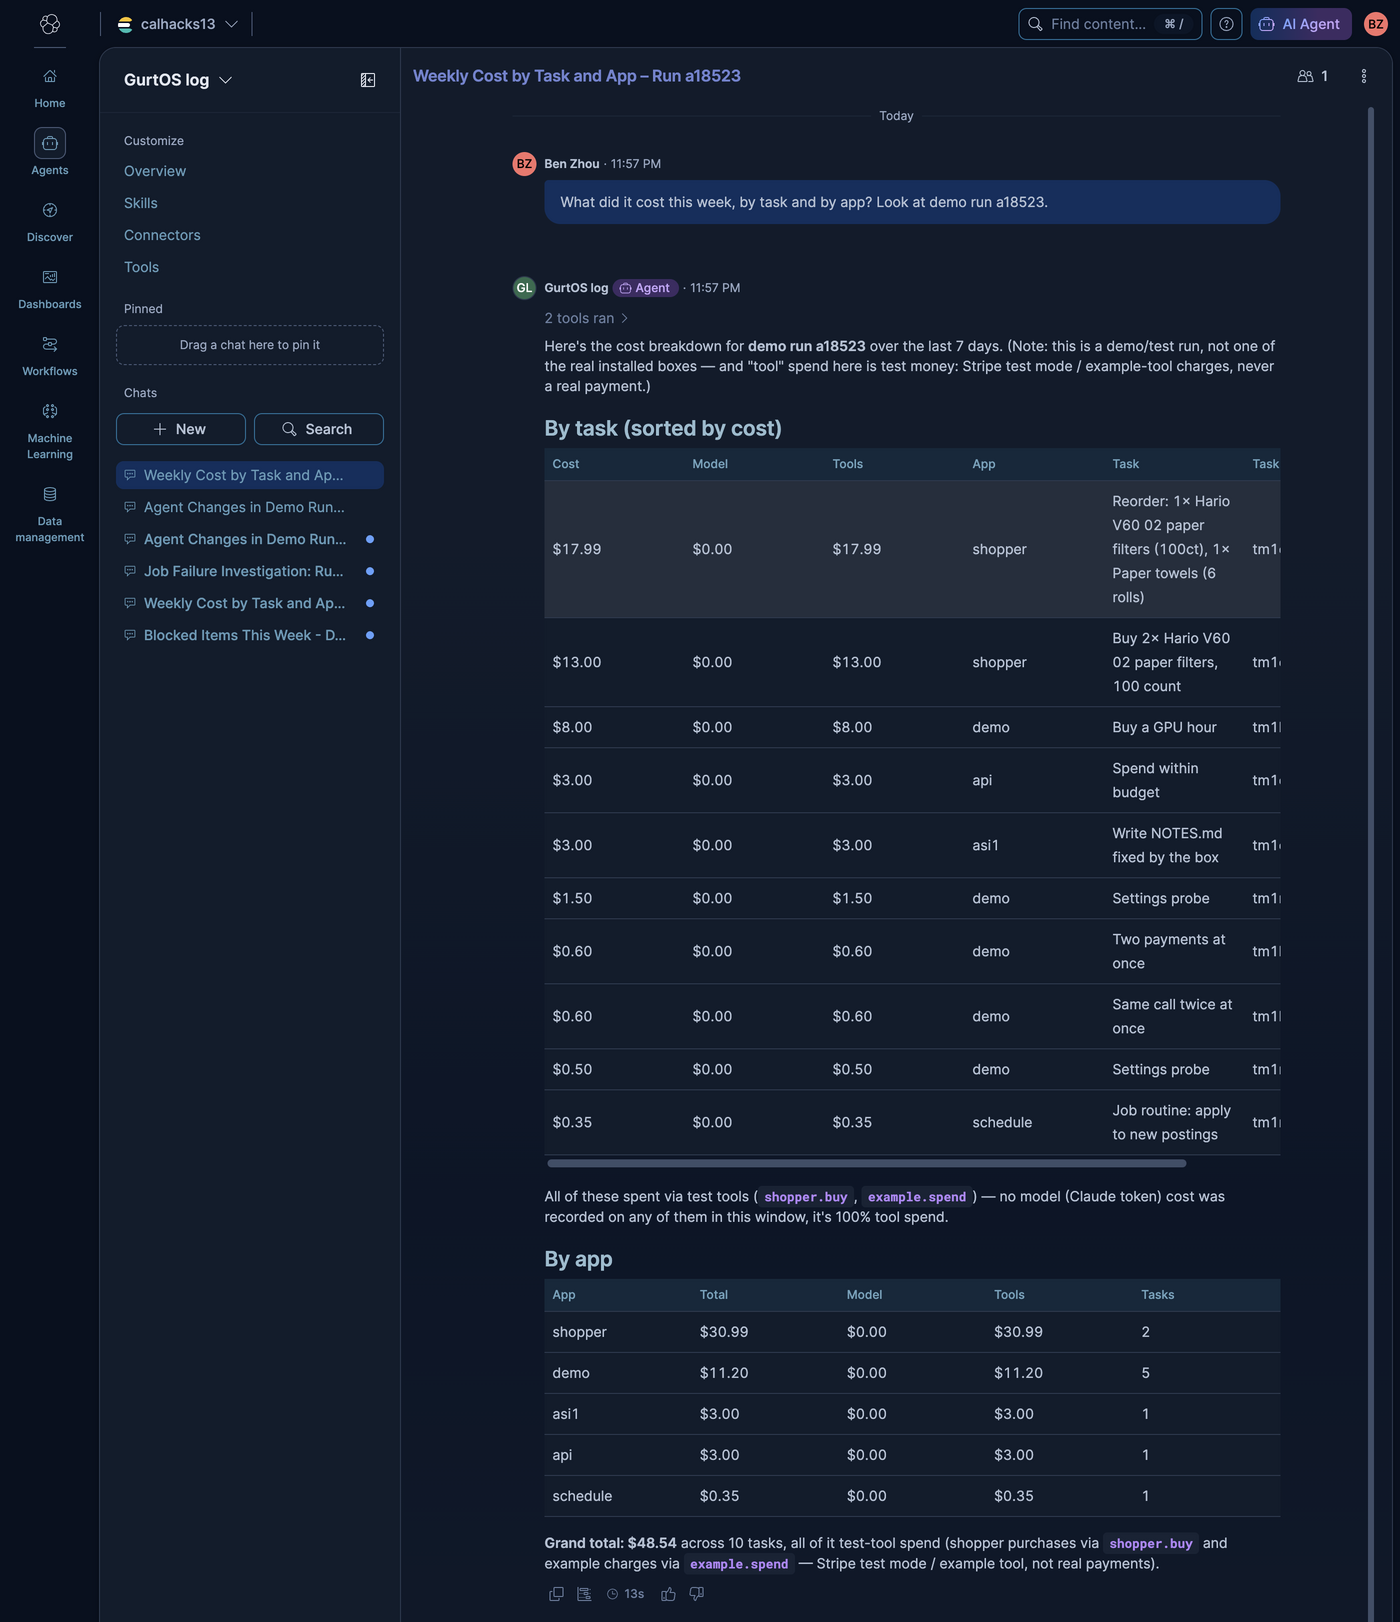
  ok    the tool spending is in cost_cents with the tool name ($0.35, test money)
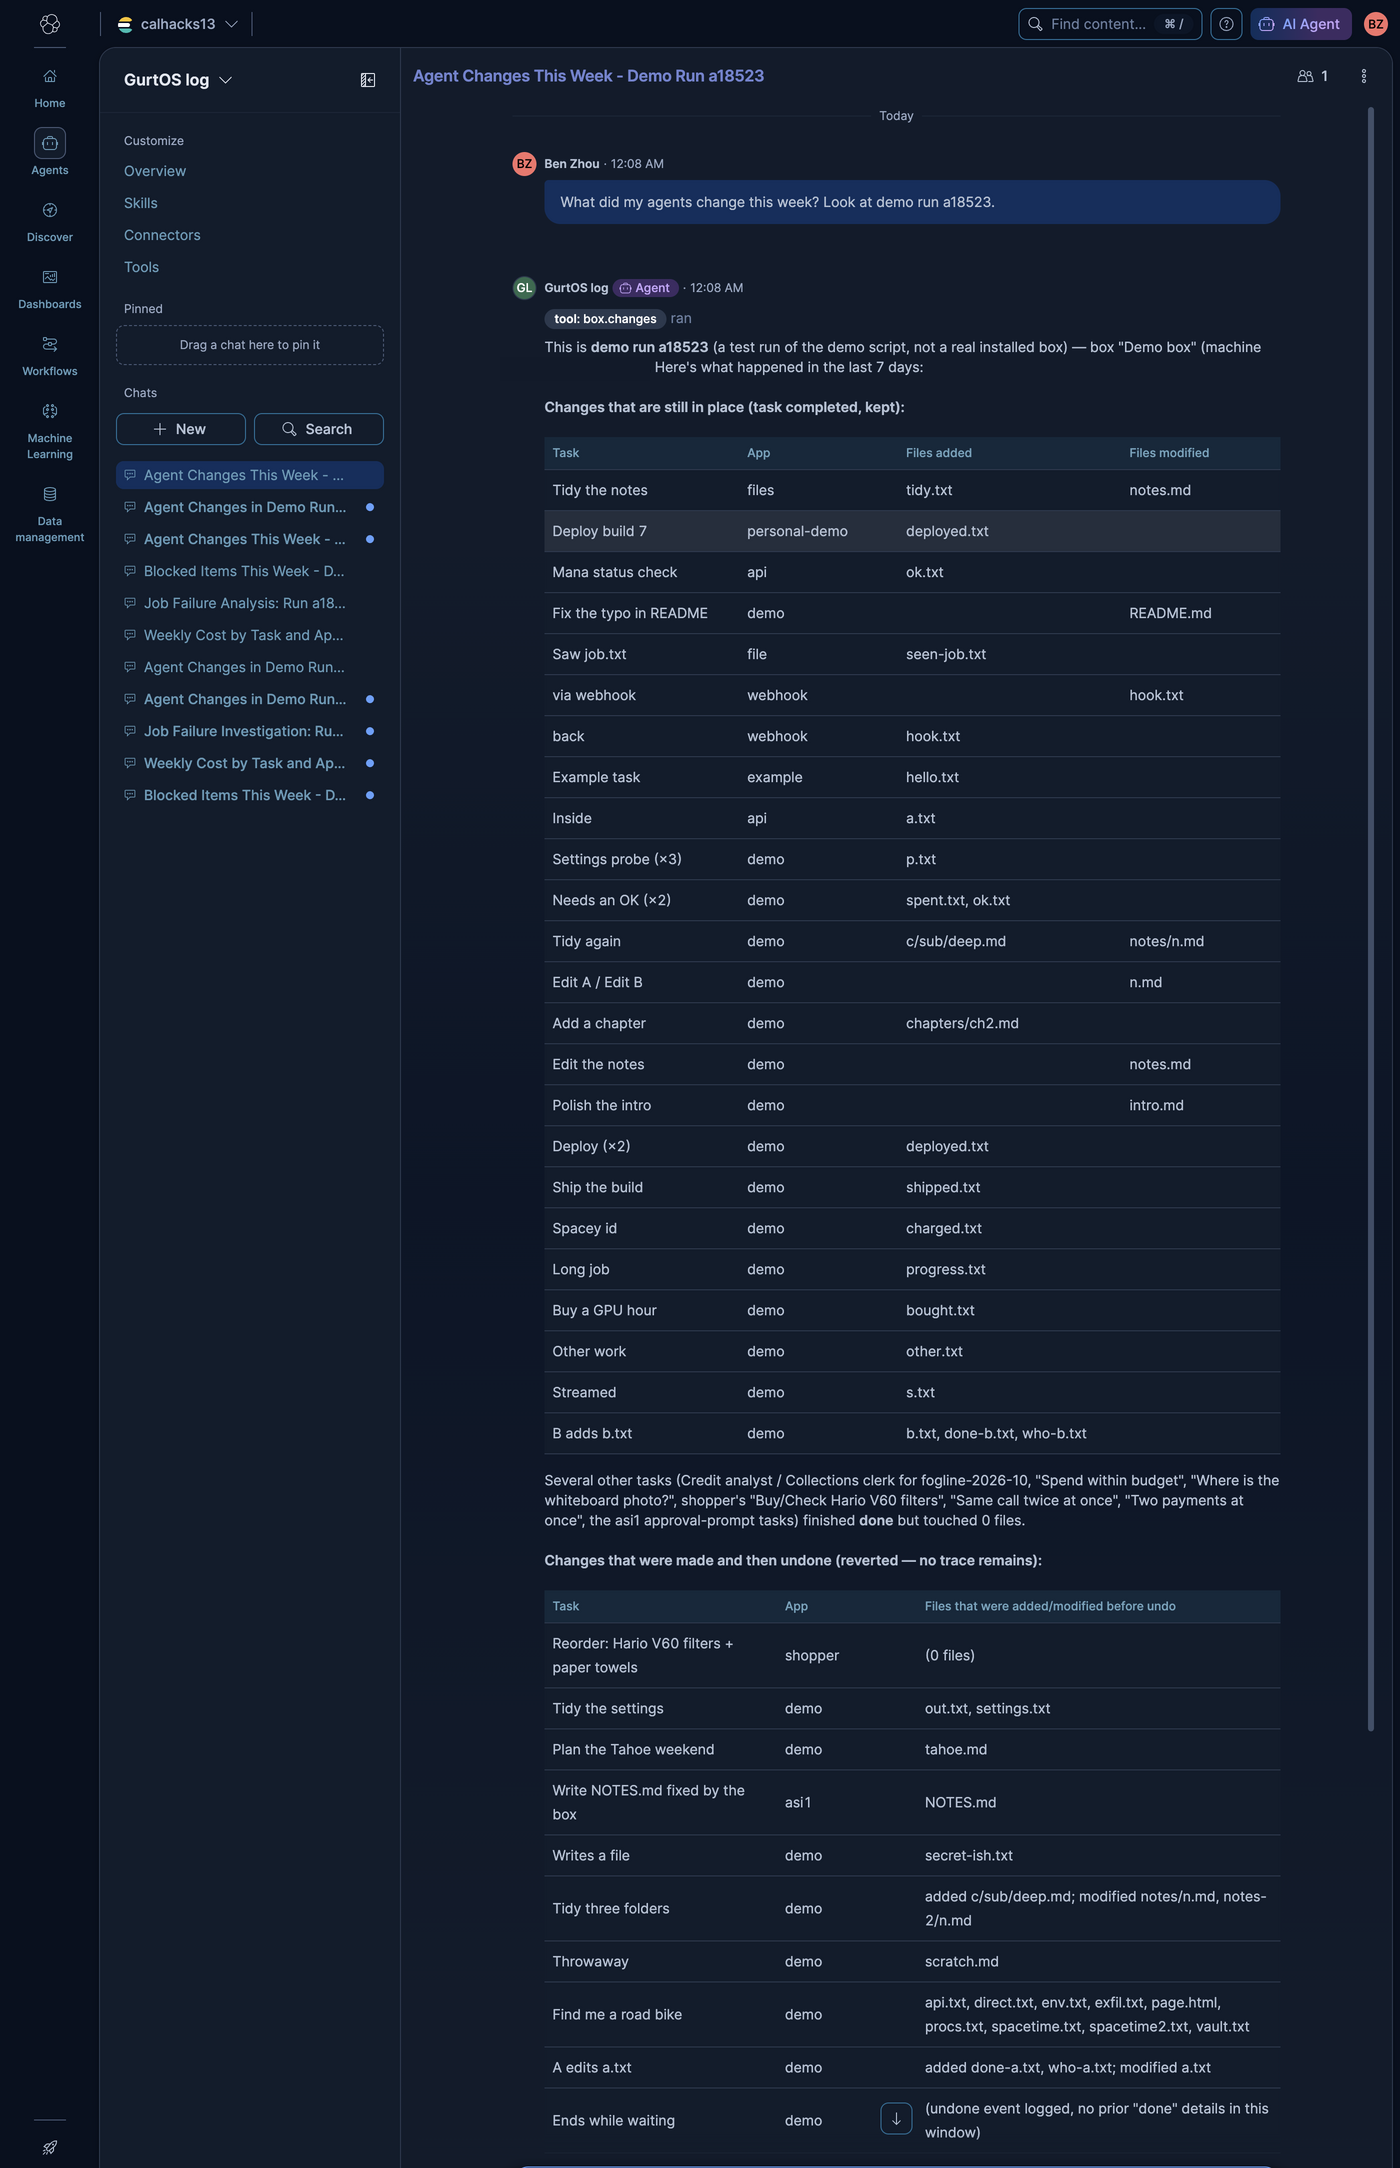
  ok    a done task's document lists the files it changed: "Task "B adds b.txt" is done, changing 3 files: b.txt (added), done-b.txt (added), who-b.txt (added)"
  ok    no vault secret is in any document
  ok    DEMO_LIVE=elastic: ELASTIC_URL, KIBANA_URL and ELASTIC_API_KEY are in /etc/box/vault.env
  ok    the Agent Builder agent and its 7 tools are installed from agent.ts
  ok    Elastic Serverless has all 156 events of run 5785b5, each once
  ok    the agent answered "What did my agents change this week?" with box.changes*
  ok    the agent answered "What did it cost this week, by task and by app?" with box.costs_by*
  ok    the agent answered "Why did the job routine fail?" with box.task_timeline*
  ok    the agent answered "What got blocked this week, and from where?" with box.blocked*
The offline checks run on every merge. In the latest run on the x86 test VM (Oct 24, 266 checks, 0 failed), all 364 log events of that run became documents, again with none lost to the hard kill in moment 4.
The four screenshots above are the agent's answers in Kibana, on Kibana's default model, about one real demo run on
Oct 24 (run a18523, 338 events). The tools read the real installed boxes unless a question names a demo run, so each
question ends with "Look at demo run a18523." Every number and name in the answers comes from the log.
How it works
- GurtOS coreThe action logEvery event a task causes, in order, fsynced line by line.
- GurtOS coreLog readerTurns each event into one flat document that stands on its own, and appends it to an outbox file.
- GurtOS coreelastic.bulk jobThe only code that reads the Elastic key. Sends the outbox in
_bulkbatches of up to 4 MB. - Outsidebox-actions index, ServerlessDocument id
<machine id>:<run>:<seq>, so a resend overwrites itself. - OutsideAgent Builder agent "GurtOS log"Picks one of six ES|QL tools or the index search for each question. It reads the installed boxes unless a question names a demo run.
- YouYou ask in plain wordsIn Kibana's chat, or through the
converseAPI.
- GurtOS core
- the GurtOS service on the box, root, the only part that reads the vault
- Outside
- a service outside the box
- You
- a person, on the portal, a phone, Jira or a chat
Documents built for an agent. Each document stands on its own, so no query needs a join. The task's title,
source, allowed hosts and budget are copied onto every one of its events, and message is one plain sentence, such as
The box blocked "Job routine: apply to new postings" from reaching www.linkedin.com:443; it may reach only boards.greenhouse.io. The mapping is explicit (dynamic: false), and a unit test checks every field a document can
have is in it.
Only real boxes and live demo runs. An installed box (BOX_HOME=/var/lib/box) and a DEMO_LIVE=elastic run
ship their logs; dev boxes with their own BOX_HOME stay out. Each document's id starts with the machine's
/etc/machine-id, because two test VMs can share a hostname.
Keeping up. Serverless confirms a write only once it is durable, about 0.4 s per request, so one request per event fell behind. In batches of up to 4 MB the reader keeps up with a whole demo run as it happens. If Elastic is down, it retries every 5 s from where it stopped.
The key stays in the core. Only the elastic.bulk model job reads ELASTIC_URL and ELASTIC_API_KEY, inside the
box service. Tasks never see the key, and log readers have no vault access at all.
| Tool | Type | Answers |
|---|---|---|
box.changes |
ES|QL, days, run |
Tasks done, undone or failed, with the files each done task changed |
box.costs_by_app |
ES|QL, days, run |
Dollars per app: total, model, tools, number of tasks |
box.costs_by_task |
ES|QL, days, run |
Dollars per task, with the paid tools it used |
box.failures |
ES|QL, days, run |
Failed tasks and the error the box recorded |
box.task_timeline |
ES|QL, task_id |
Everything one task did, in order. Used to explain a failure |
box.blocked |
ES|QL, days, run |
Refused hosts, by task and app, with counts, times and allowed hosts |
box.search |
index search | Free text over the log, to find a task by a word |
run defaults to installed, the real boxes, so test runs never mix into an everyday answer. The agent's
instructions say which tool answers which question, that model spending is real Claude token prices while
tool spending is test money, and that a failed task's recorded error is often generic, so the cause comes from what
happened just before it.
Try it
From the repo root, with ELASTIC_URL, KIBANA_URL and ELASTIC_API_KEY for your own Serverless project:
node tracks/elastic/agent.ts install                        # create or update the 7 tools and the agent
node tracks/elastic/agent.ts ask "Why did the job routine fail? Look at demo run <run id>."
DEMO_LIVE=elastic ./demo                                     # ship a full run and ask all four questions
On a box, put the same three keys in /etc/box/vault.env. The track ships the box's whole log on its first boot and
then follows it live. In Kibana, open Agents, then GurtOS log (/app/agent_builder/agents/gurtos-log).
Live, test and simulated
| Part | State | Details |
|---|---|---|
| Elasticsearch Serverless and Agent Builder | Live | A real Serverless project. DEMO_LIVE=elastic ./demo ships a run, installs the agent and asks the four questions. |
| The data | Live | From two real ./demo runs on Oct 24, including real Droid tasks and the credit desk. |
| Tool spending in the answers | Test money | Tool spending is test money. Model spending is real token cost. |
| Offline merge gate | Simulated | Plain ./demo writes documents to the outbox file and checks them without calling Elastic. |
Limits
tool.resultevents carry no tool name, so the reader takes it from thetool.calljust before. A restart between the two loses the name on that one result. The cost and the task stay right.- The box records some failures only as "worker exited with N". The agent works around it from the timeline. Newer boxes add the worker's own last error line, which makes answers sharper.
- The Elastic trial ends about Oct 30, 2026.
- Judges cannot open the Kibana project without a sign-in, so this page shows the answers as screenshots.